
Spreadsheets are great, but they also come along with a whole raft of limitations. You’ll know this if you’ve ever tried using spreadsheet tools to manage or monitor large datasets. Today we’re looking at one important workaround - how to build a Google Sheets dashboard.
Of course, Google Sheets is incredibly useful for storing and manipulating all kinds of data.
This could be financial data, personal information, KPIs, key metrics, or any other kind of business intelligence. What makes spreadsheet tools like Google Sheets so popular is their flexibility.
But, they’re far from the perfect solution for every use case.
Today, we’re going to explore some of the situations where you might decide you need additional tools to supplement your data workflows. Specifically, when it comes to presenting key insights to decision-makers - without the need for time-consuming data visualization and manual analysis of raw data.
We’ll also take a deep dive into how low-code development is changing the landscape here - and how Budibase empowers businesses to build incredible custom tools, in as little as five minutes.
Let’s start with the basics though.
What is a dashboard?
A dashboard is a simple app for presenting data. Essentially, this boils down to two things:
- A data source - where information is stored.
- A presentation layer - where stored data is displayed in an attractive and easy-to-read format.
You might also build in some business logic, including calculations or deriving aggregate values. Depending on the complexity, this could be part of either of the above elements or an intermediary layer of its own.
Most often, the data source will already be in use for an existing process or workflow. Dashboards provide a quick, easy way to check in on your progress across specific metrics relating to these processes.
In this context, a Google Sheets dashboard is a dedicated visualization and reporting app, that uses an existing Google spreadsheet as its data source. For example, leveraging data that you gather through Google Forms.
So, say for example you wanted to monitor how different assets are deployed across your organization. We can pretty safely assume you’re already tracking which devices are used by different departments, teams, and employees.
The missing step is creating a single resource for decision-makers to access key insights and important data about this.
Check out our open-source IT asset management software template for more details on how this works in practice.
This simple example points to an important fact about dashboard apps.
That is, the ultimate goal here is to facilitate better decision-making by empowering stakeholders with digestible, actionable insights.
Couldn’t I just build a report in Google Sheets?
Well, yes, you could. Indeed, there are plenty of free Google Sheets dashboard templates out there, with a range of pivot tables, pie, charts, column charts, and more.
So a better question is why would you want to build a dedicated dashboard tool instead of just using Google Sheets’ built-in reporting capabilities?
After all, if you’re here, we can safely assume that you’re already using Google Sheets to manage whatever data set you have in mind.
There are several things at play here that make traditional spreadsheets less than ideal, especially on a larger scale. In large part, this comes down to what’s known as separation of concerns.
That is, any strategies or techniques you use to distinguish between different functions, resources, and end-user goals within the tools and resources you provide. Unfortunately, spreadsheet tools, including Google Sheets, fall well short here.
The problem is this. Spreadsheets are an easy way to enter, store, manipulate, and present data, but they offer limited options for separating these tasks for different users, processes, and workflows.
This impacts:
- Usability - Overloading users with options is never efficient.
- Security - Spreadsheets make it difficult to tailor data exposure to specific users’ needs.
- Accuracy - With poor usability, you’ll also increase the risk of human error.
- Validity & integrity - When accuracy suffers, it’s hard to have confidence in our data.
- Functionality - If you need specific functionality that Google Sheets doesn’t offer, you might simply be out of luck.
- Scalability - Spreadsheets might work for your present needs, but as your data set and user base grow, things will get messy.
Things also get particularly messy if you need to draw on real-time data from multiple spreadsheets in a single report or build relationships between different entities. Say we wanted to pull in real-time Google Analytics data and values from our CRM.
We'd have a very hard time doing this - even if we could get all the necessary data to create a dashboard in Google Sheets.
Build custom workflow apps on top of any data with Budibase
Get started for freeTake a look at our guide to choosing the best database management software.
What does a dedicated dashboard tool offer?
So how exactly will a dedicated Google Sheets dashboard solve these problems?
Honestly, it depends.
After all, we are talking about building a custom tool here. With that in mind, let’s think about the kinds of additional tools and functions that you’ll enjoy with a dedicated dashboard.
Here’s a brief overview of the kinds of things you’ll want to look out for - along with what Budibase brings to the table under each.
Interface design
Google Sheets might make it easy to build reports, but the end product doesn’t exactly scream professionalism. By contrast, creating a custom dashboard gives you far greater flexibility to craft experiences for your specific end users.
But wait - I don’t have time to learn how to design an app!
Well, nowadays you don’t need to be a designer to build professional interfaces. With low-code tools, like Budibase, you can build world-beating designs, in minutes, with almost no prior experience.
Security
Spreadsheets and security is a contentious subject. Without getting too deep into it, there’s nothing inherently insecure about Google Sheets or Google Workspace more generally. In fact, Google’s office tools offer better security than most people think.
However, we can say that Workspace can fall short when you have more specific security requirements.
Access control is a key issue here. Again, if you have needs that Google can’t support, you’re pretty much stuck.
This is another area where custom Google Sheets dashboards really shine. Budibase offers fully customizable role-based access control, to help you maximize security and usability alike.
Scalability
Spreadsheets are never a scalable solution. That is, if either your data set or your user base gets too complex, you’ll inevitably encounter problems. Anyone who’s ever tried to use a spreadsheet with more than a couple of colleagues can attest to this.
At a certain point, you’re going to need to move towards dedicated tools if you want to scale your workflows.
Creating dedicated tools for discrete functions is a crucial part of this.
Custom solutions will always offer superior scalability, whether this relates to users, data, functionality, or reliability.
Customization
We’ve said a few times now that one problem with relying on Google Sheets is a relatively low scope for customization. That is, if Google doesn’t offer a feature you need, there’s not much you can do about it.
Sure, you have integration options and plug-ins, but this results in comparatively little flexibility.
Budibase is a whole different ball game. We offer a whole suite of tools for building automations, formula variables, data validation, conditional UIs, responsive apps, integrated tools, and more.
Deployment
This one ties in with security, of course. If you have more advanced needs around how and where you host your dashboards, you’ll more than likely want to opt for a more elegant solution.
Budibase is the smart choice here. We offer our own cloud hosting platform, as well as optional self-hosting with Docker, Digital Ocean, and Kubernetes.
Choose the right hosting solution for your unique requirements.
Build a Google Sheets dashboard and deploy it to the cloud, your local network, or a dedicated machine. With Budibase, the choice is yours.
You might also like our round-up of the top Airtable alternatives.
Building a Google Sheets Dashboard with Budibase in 7 easy steps
Enough theory. If you’re reading this, you probably already know you want to build a Google Sheets dashboard.
We’ve said throughout that Budibase makes building tools easier than ever. So, let’s put our money where our mouth is and show you just what we mean.
1. Create a new app and choose Google Sheets as your data source
First thing’s first, we need to create a new app project. If you don’t have one already, you’ll need a free Budibase account. You'll also want to create a Google Sheets document if you don't have one already.
You can sign up here.
First of all, you’ll be asked to choose a name for your app. This will also be used to set the URL users go to to access it, so it’s best to choose something memorable but concise.
Next, you’ll be prompted to select your data source. As you might have guessed, we’re going to choose Google Sheets.

For a different project, why not check out our tutorial on building a MongoDB CRUD app?
2. Connect to your spreadsheet
With our app project created, we need to establish a connection to our Google Sheets data. Budibase is designed to make connecting to external data a breeze. You’ll be happy to hear that you don’t need to write a single line of code
Instead, you need to do two things. First, sign in with your Google account:

And paste your spreadsheet URL into Budibase. You can also name your data source at this point:

It’s really that easy.
On a side note, we also have similar connector tools for a huge variety of other kinds of data. Check out our ultimate guide to data sources for web apps to find out more.
3. Fetch your tables
Now that we’ve connected to our data source, it’s time to pull in specific data. So, in your source file, you might have more than one sheet of data.
With Budibase, we can pull each individual sheet in, and treat it like we would a table within our internal database. Any changes in either platform are then reflected in the other, in real-time.

It’s helpful to remember here that you probably won’t need every attribute and value in your data set for your dashboard. So, we might only fetch specific tables, or we might need all of them to get the information we need.
Let’s take a look at our Google Sheets file for context. We have two sheets - one for orders:

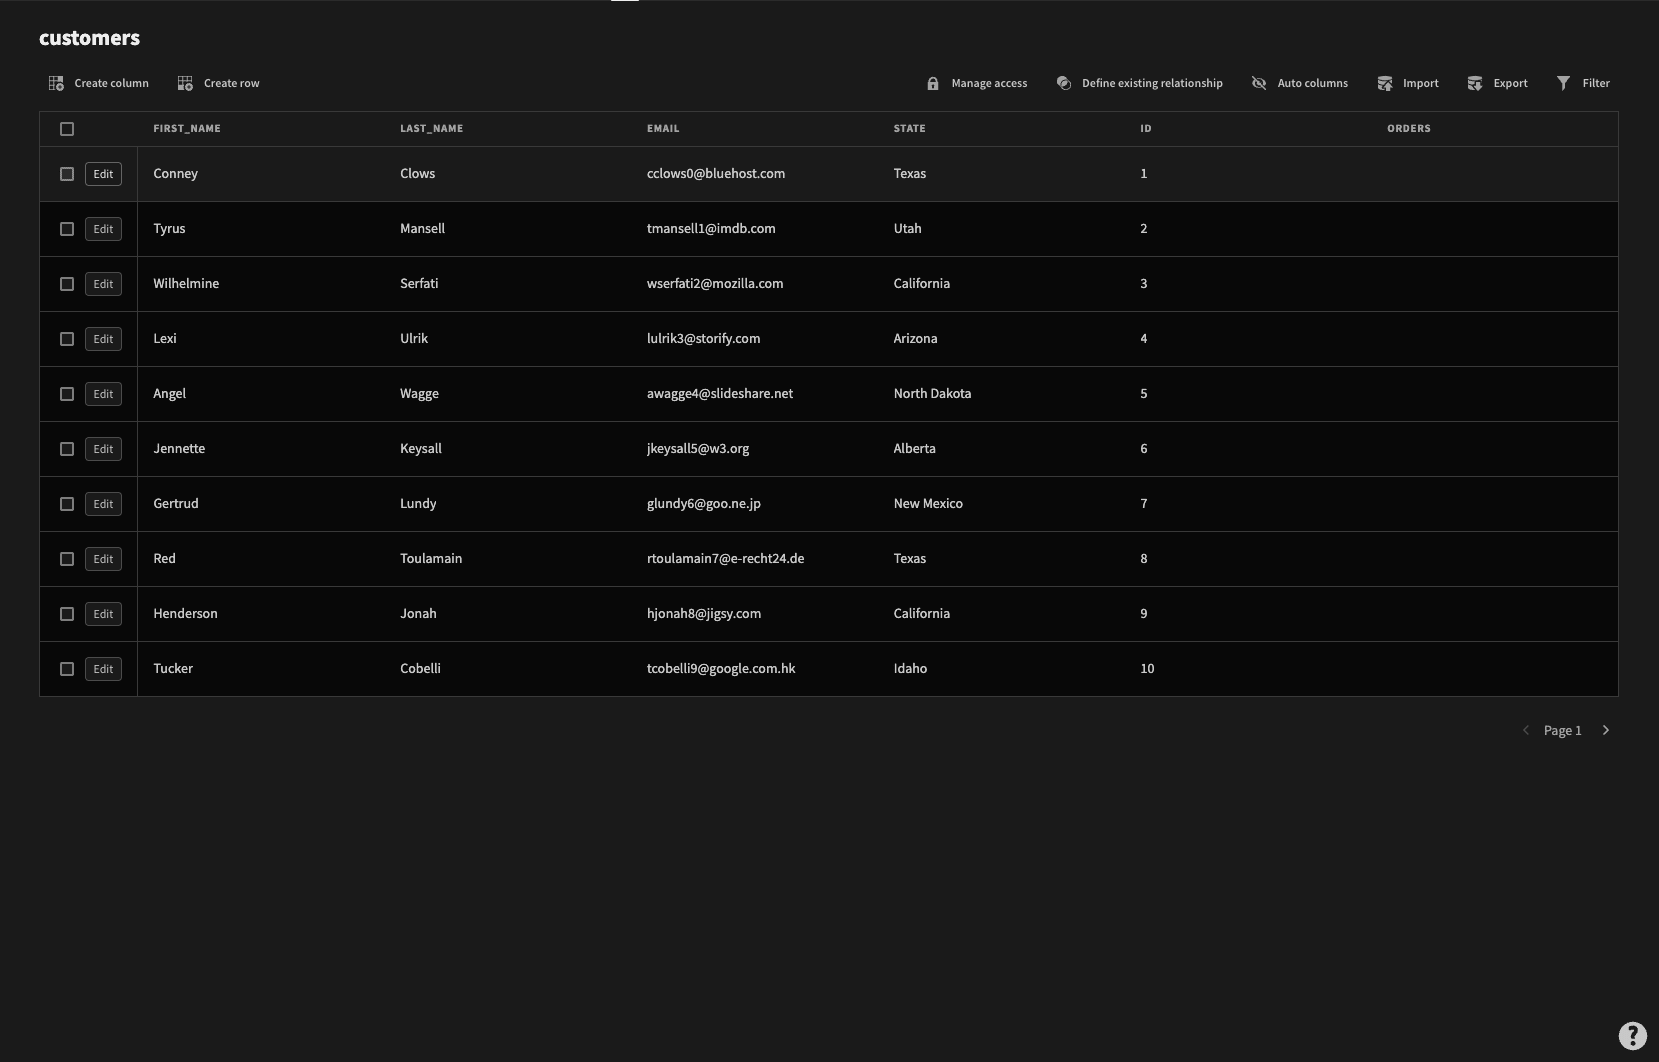
And another for customers:

Once we’ve fetched them, our data source will look like this.

We can also view the complete tables. So, here’s orders:

And customers:
4. Configure your data
We can also add some extra configuration to our tables to make them behave a bit more like a traditional database. For example, we can add access controls, build relationships, or create extra attributes, views, and filtering options.
We said earlier that there are some key areas where Google Sheets falls short, especially when managing data at scale. This is our chance to bridge the gap in terms of databases vs spreadsheets.
Let’s assume we’re going to need to build some relationships between our tables to perform aggregate the information we need for our dashboard.
On either table, we can create a one-to-many or many-to-one relationship, linking it to the other, by clicking define existing relationships.
For example, this allows us to use attributes from one table as bindable elements in formula variables in the other, as well as other important functions.
We’re also going to build a few custom queries to get some aggregate values for our Google Sheets dashboard. Specifically, we want:
- The total number of orders.
- The total sales volume.
- The average order value.
Click add a query.
We can then do this using simple JavaScript transformations under the data tab. First, we’ll get the number of orders by returning the number of rows in our sheet with the .length property:

Then, we’ll iterate through all of the rows and add up their value attributes, to get our total sales volume:

And finally, we’ll use the same expression again, but this time divide it by the number of rows, to get our average value:
At this point, we can also create bindings for our custom queries. In other words, we can set dynamic variables that allow users to control aspects of our custom queries from the dashboard’s front end.
For example, to filter data based on specifiable conditions.
5. Build your dashboard interfaces
Now for the fun stuff.
As far as app UI design goes, dashboards are actually pretty straightforward. At least, we’re not too worried about interactivity as such - dashboards mainly aim to present information, so there aren’t usually many user actions to account for in our UIs.
So, our first task is to decide on the clearest way to present all of the information we need to include.
The challenge here is that we have limited space on users’ screens to present information. So, we need to prioritize.
Normally, the strategy here is to try and make the top-level insights as prominent as possible. We can also leverage what’s known as clustering. This means grouping similar resources and metrics together, to make it easier for users to find specific insights.
Let’s say we want to create a single-screen dashboard for monitoring our orders and customers. Head over to the design tab in Budibase, and create a new screen:

First, we’ll create some stat cards using the custom queries we built earlier. We’ll start by creating a new container:
Then, we’ll add in a data provider, and set it to our first query - our order count:

We’ll add a stat card component and set the title as Orders and then bind the output under the Value field:

Here’s what it should look like so far:

Then, we’ll repeat the same process for our other two custom queries. This is the end result:

Let’s check out some cool visualizations too. Say we want to display a timeline of our orders, so we can figure out if there are any seasonal trends. Start by adding a new data provider below your cards container
We’ll set this one to the entire orders table, rather than a specific query, and set the sort column to the date attribute:

Then, we’ll add a bar chart component inside this, with date as our label column and value as a single data column:

We also offer a range of other graph and chart types, including pie, scatter, and line charts.
Since we’re just playing around with dummy data, we won’t waste your time showing off every possible chart or visualization tool you can use. Instead, the idea is to give you a flavor of just how quick and easy it is to build an attractive Google Sheets Dashboard in Budibase.
For a slightly different spin on this, why not check out our guide to using a form to enter data to Google Sheets?
6. Add extra functionality
One of the truly obvious selling points of using a dedicated dashboard over Google’s built-in tools is the ability to add extra functionality that Sheets can’t support.
We can think of this at a couple of different levels. For today, we’ll think about two:
- How you manage access to your Google Sheets Dashboard.
- What actions users can take within it - and how.
On the first point, one of the many aces up our sleeves is Budibase’s built-in role-based access control. Assign users to pre-defined roles, and grant them access at the level of data, screens, or even individual components.
This is the ideal way to maximize security and usability alike - giving users the exact right data exposure for their day-to-day needs.
On the second point, Budibase is the perfect tool for all sorts of process and workflow automation.
Without writing a single line of code, you use our block-based editor to build highly advanced, custom automation rules. We offer easy-to-configure blocks for triggering queries, third-party integrations, custom JavaScript, system logs, and more.
7. Deploy your Google Sheets Dashboard
Finally, it’s time to think about how you want to get your Google Sheets dashboards in front of your decision-makers. This means deciding how you want to deploy and host your application.
With Budibase, you have complete control over how and where your tools are hosted.
Choose Budibase Cloud to publish your Google Sheets dashboard as a web app, in just one click.
Or, you might opt to self-host your Budibase tools. Enterprises and massive organizations across the world choose Budibase to build custom apps and push them to their own infrastructure.
As always, Budibase offers you a few different options here, to suit different requirements. Use Kubernetes, Docker, Digital Ocean, and more to deploy your tools locally or on a private cloud.
Self-hosted Budibase tools offer the ideal combination of flexibility, configurability, security, and control.
Check out our hosting and deployment docs for more information.
Start using Budibase today
At Budibase, we’re on a mission to change the way businesses build custom tools. We empower our users to create fully functional apps, in a fraction of the time.
We’re proud to offer the most innovative open-source, low-code platform around.
Whether you want to save your internal developers time, cut out contractors, or empower your employees as citizen devs, Budibase is built for speed, efficiency, and cost-effectiveness.
We’re biased, but we think Budibase is the smart choice for busy teams who don’t want to compromise on results. Tens of thousands of companies think the same.
We’ve even created 50+ free, deployable app templates to show off just what Budibase is capable of.
Sign up to Budibase for free today to start building apps the fast, easy way.
You might also like our tutorial on how to make an app from Excel spreadsheets.